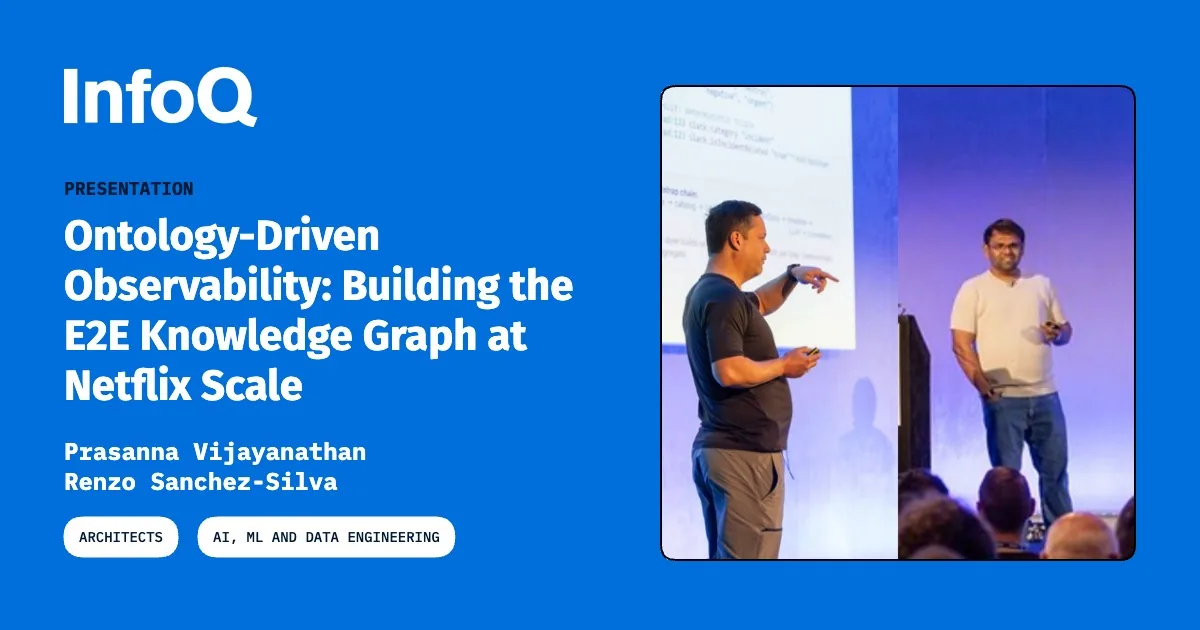
Netflix engineers Prasanna Vijayanathan and Renzo Sanchez-Silva described a shift from reactive monitoring to an AI-driven operational ontology that processes more than 38 million telemetry events per second. The system unifies logs, metrics, events and traces into a queryable end-to-end knowledge graph, with agentic workflows built around Claude and graph databases. For business, the case matters because it shows how automated triage and root-cause analysis can replace hours of cross-team debugging.
From 65M streams to a data engineering problem
The scale behind the project was framed through three figures: 65 million concurrent streams during the Jake Paul and Mike Tyson boxing match at the end of 2024, more than 2 billion requests per day from client applications to servers, and upward of 38 million real-time logging events per second. That load comes from televisions, phones and laptops worldwide, thousands of microservices, content delivery infrastructure, and thousands of concurrent A/B experiments. At that level, correlating what a viewer experiences with backend performance stops being a tooling task and becomes a data engineering task.
The proposed answer is an end-to-end view that connects a device through networks and gateway services into backend dependencies in real time. Instead of watching single services and waiting for alerts, the vision calls for detection within minutes across the full stack, automatic prioritization by user impact, and automatic triage to the responsible team. The next steps are automated root-cause identification, prediction of issues before users feel them, and suggested or executed corrective actions. The components named for this are a shared operational ontology, MELT telemetry modeled as a knowledge graph, and agentic workflows.
The reason for the redesign was illustrated with an investigation from the past year that lasted about four hours. A client-side alert appeared around 3:30, was observed for roughly two hours, then triaged to another team that had already been debugging since 1:30. The cause was traced around 6:30 to a service that had reduced capacity, creating backward-propagating errors, with a fix rolled out within an hour. The speakers presented this as an average case, yet it involved nine paged teams, more than 30 engineers, and three related incidents flagged in parallel.
What automated triage means for operations
For companies operating digital services, the practical effect is a shorter path from symptom to owner. When telemetry is unified rather than stored in separate datastores with different structures, an alert carries context about affected users, dependent services and experiments. That reduces the manual work of following one error across teams and avoids duplicate investigations already underway elsewhere. Large organizations feel this as fewer parallel war rooms, while smaller firms can apply the same principle on a narrower stack with fewer integrations to maintain.
The approach has clear limits that buyers should verify before copying it. The speakers pointed to siloed data sources and disconnected alerting, where each team tunes monitors to its own store without shared context or standards. A knowledge graph only helps if log, metric, event and trace formats are normalized and kept current as services and devices change. Questions to ask vendors concern ontology maintenance, query latency at peak load, how agents using models such as Claude are constrained, and how predictions are validated before any self-healing action runs.
A concrete marker to watch is whether Netflix reports detection in minutes with automatic prioritization by user impact and triage without manual service-hopping. Publication of follow-up results on prediction accuracy and corrective actions would signal that the graph has moved beyond faster investigation. Without that evidence, the project remains a strong observability upgrade rather than proven autonomy.